Growing Financial Divide Between Large and Small Colleges & Universities
Growing Financial Divide Between Large and Small Colleges & Universities
Overall, the industry earned about $954 billion in revenue, after an 8.9% revenue growth from the prior year. Of the 1,947 public and not-for-profit colleges in 2025, 229 lost money for the third consecutive year.

Below are four observations from the data:
1. Revenues outpaced expenses — for the third year in a row
In total, the institutions we studied took in $954.0 billion in FY2025 and reported $826.7 billion of expenses and other losses.
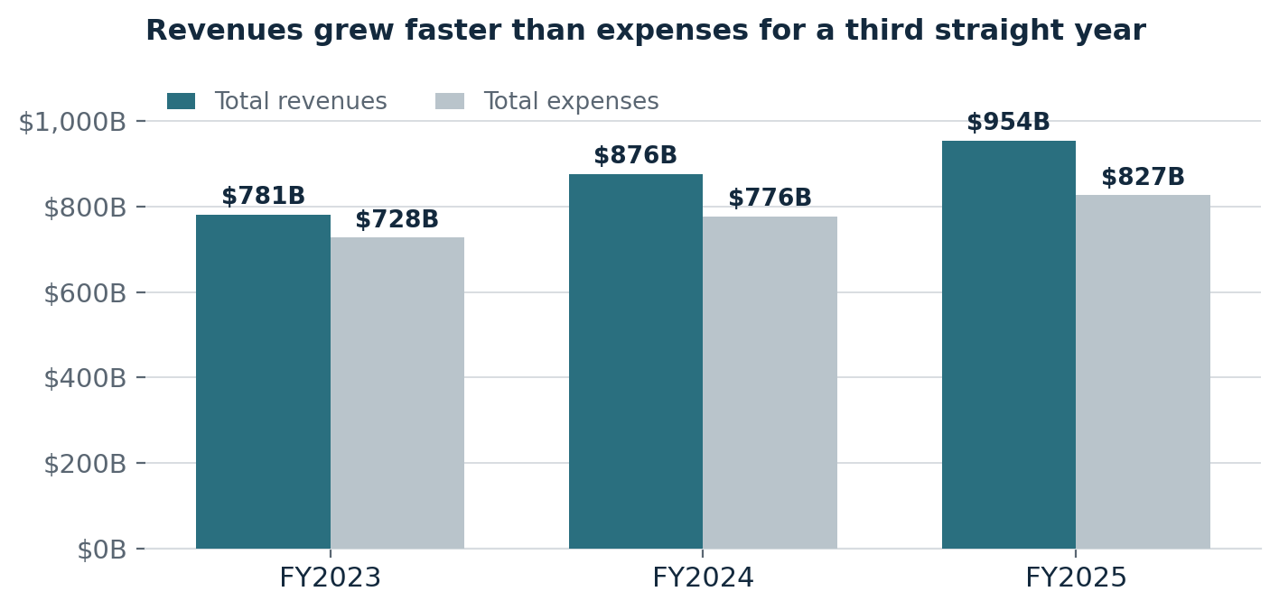
Aggregate revenues and expenses, 1,938 institutions reporting all three years.
In the aggregate, expense growth has been 6.5% consistently over the past three years, but 51% of the individual institutions we analyzed grew expenses faster than revenue in FY2025.
2. The surplus you report may not be the surplus you can spend
Across the sector, the reported change in net assets rose to $127.3 billion in FY2025, up from $99.8 billion in FY2024 and $53.9 billion in FY2023. But only $71.3 billion of that FY2025 surplus was unrestricted. The remaining $56.0 billion is donor restricted or reflects endowment appreciation that cannot be used at the discretion of the college.
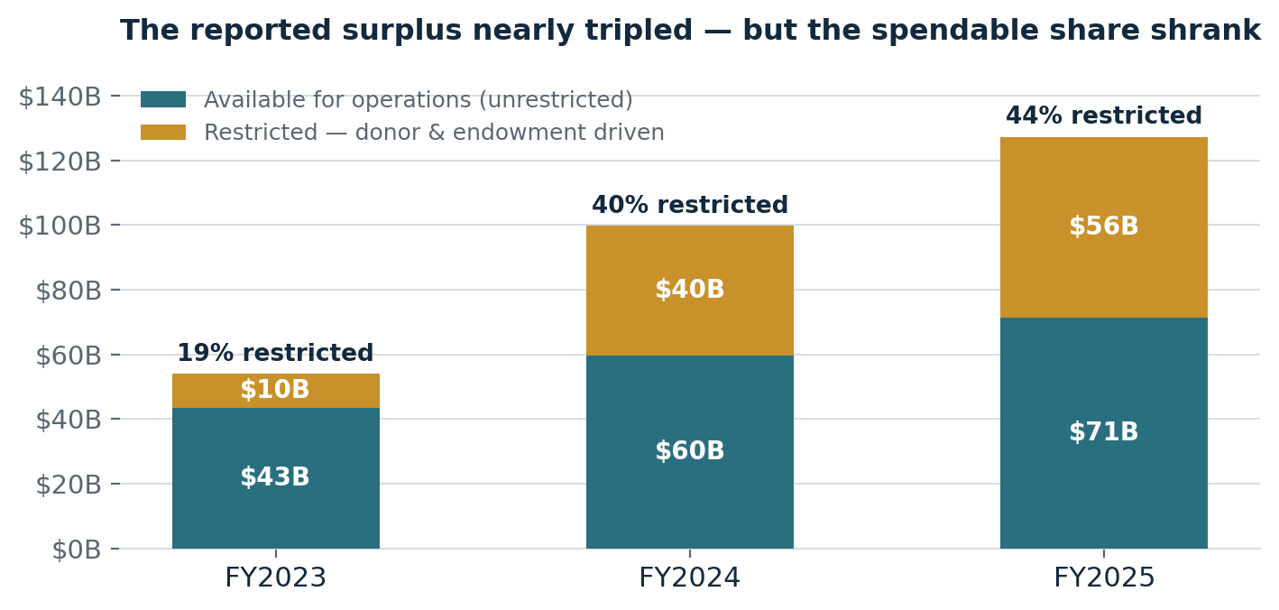
Change in net assets, split between amounts available for operations and amounts subject to donor restriction.
Strong investment markets and successful fundraising campaigns are welcome and desired, but they are not the same thing as operating strength, and a bottom line inflated by them can mask underlying problems in operations.
3. Size has become the single best predictor of direction
The largest institutions are growing revenue substantially faster than expenses. The smallest are doing the opposite.
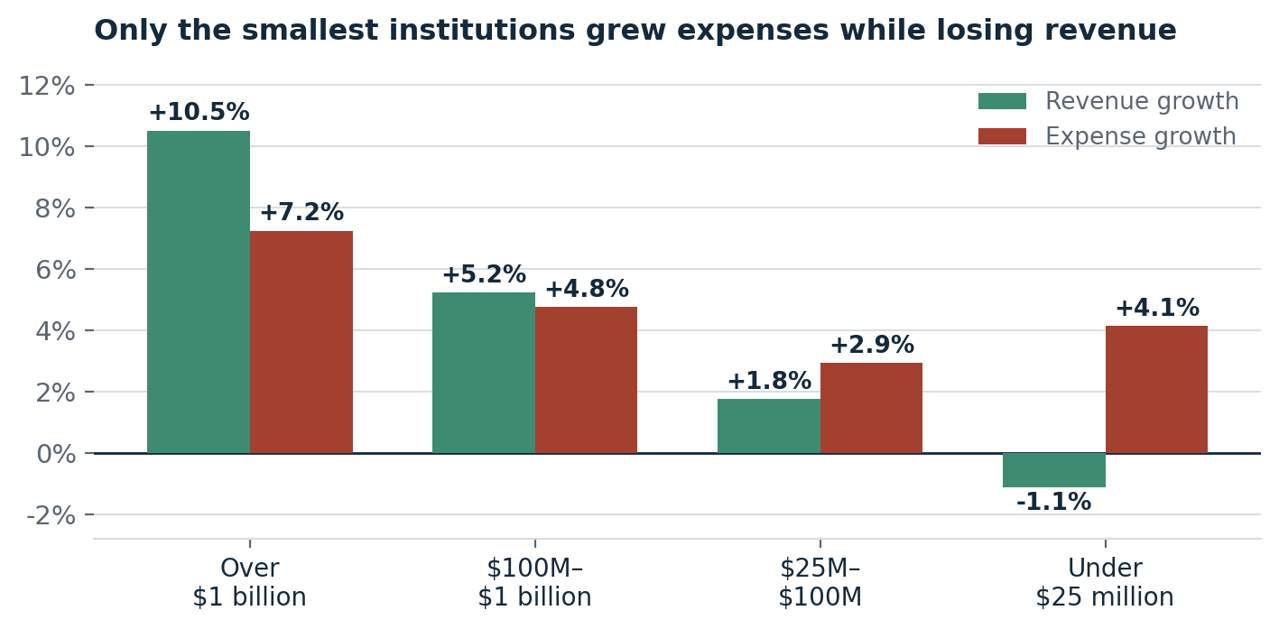
Revenue and expense growth, FY2024 to FY2025, by institution size in total revenues.
Institutions above $1 billion in revenue grew revenue 10.5% while holding expense growth to 7.2%. Institutions between $100 million and $1 billion grew revenue 5.2% against 4.8% of expense growth. Institutions between $25 million and $100 million grew revenue 1.8% while expenses rose 2.9%, and the smallest revenue generating institutions, which are under $25 million in revenue, lost 1.1% of revenue while adding 4.1% of expense.
43% of institutions under $25 million saw revenue fall outright, as did 38% of those between $25 million and $100 million. Across the whole sector, 215 institutions saw revenue drop by more than 10% in a single year.
4. Nearly one in three institutions spent more than it took in
30% of institutions ran a deficit in FY2025, 33% ran a deficit in FY2023 and 30% ran a deficit in FY2024.
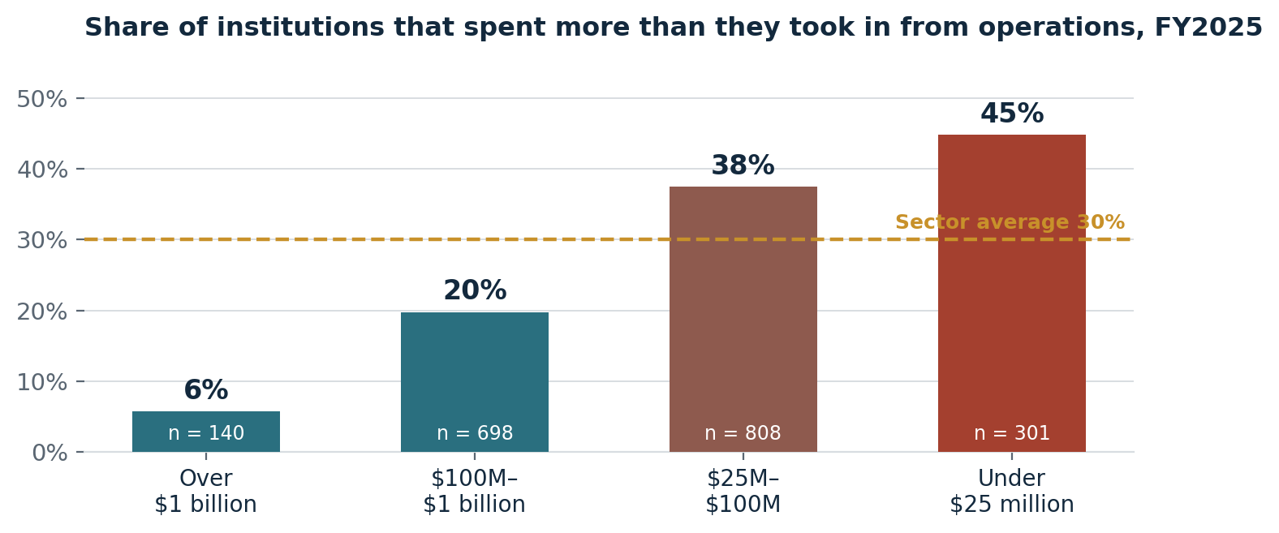
Share of institutions reporting a decline in net assets without donor restrictions, FY2025.
About one in eight of those with three years of comparable data posted operating deficits in FY2023, FY2024 and FY2025. 209 of those are not-for-profit institutions and 20 are public. 330 ran deficits in two of the three years.
A single deficit year can reflect timing of one-time events, but consecutive years can indicate structural problems that need to be addressed.
Published: 08/25/2026
Readers should not act upon information presented without individual professional consultation.
Any federal tax advice contained in this communication (including any attachments): (i) is intended for your use only; (ii) is based on the accuracy and completeness of the facts you have provided us; and (iii) may not be relied upon to avoid penalties.